
What you need to do
The practical activities and techniques you need to master – what to practice, what to get good at, and what to keep doing.

Hypothesis formation
Writing a clear, falsifiable prediction before running any experiment. A strong hypothesis follows the structure: 'If [specific change], then [expected outcome], because [reasoning based on data].' The reasoning matters most – it forces you to articulate the user behavior or psychological principle you're betting on. A hypothesis without reasoning is just a guess. Before writing the hypothesis, define your metrics: one primary metric tied directly to the expected outcome, 2–3 secondary metrics you hope to see improve, and 5–10 guardrail metrics you cannot afford to harm. Research shows that tests with specific hypotheses are 3x more likely to drive meaningful changes than tests run without one.
Sample size calculation
Determining how many users you need before the experiment starts – not after. Four inputs drive the calculation: significance level (typically 0.05), statistical power (typically 80%), baseline conversion rate, and minimum detectable effect (MDE) – the smallest improvement worth detecting. If your baseline conversion is 5% and you want to detect a 10% relative lift (to 5.5%), you need roughly 30,000 users per variant. Lower MDE requires more users. Higher power requires more users. Lower baseline requires more users. Use online calculators (Evan Miller's, Statsig's, Optimizely's) to compute this before launch. If you don't have enough traffic, you either need a longer experiment duration, a larger MDE threshold, or a different approach entirely.
Statistical significance and p-values
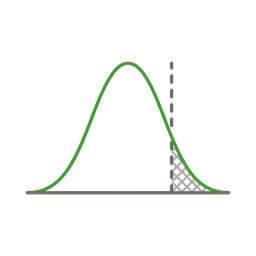
Understanding what your results actually mean – and what they don't. A p-value of 0.05 means: 'If there's truly no difference between A and B, there's only a 5% chance we'd see results this extreme.' It does not mean 'there's a 95% chance B is better.' Statistical significance tells you the result is unlikely to be random noise; practical significance tells you whether the effect is large enough to matter. A 0.1% conversion improvement might be statistically significant with enough data but not worth the engineering effort to implement. Always report confidence intervals alongside p-values – they show the range of plausible effect sizes, not just whether the effect exists.
Guardrail metrics
Protecting what matters while you experiment with what might improve. Guardrail metrics are critical business indicators you monitor during every experiment – safety nets that catch negative side effects your primary metric misses. Airbnb monitors revenue, bounce rate, and page load speed. Netflix watches stream start times and buffering ratios. Common guardrails include: page load time (performance), error rate (stability), revenue per user (business health), and support ticket volume (user satisfaction). The statistical challenge: with 10 guardrail metrics at alpha 0.05, the false alarm rate is ~40%. Use non-inferiority tests (is the guardrail not significantly worse?) rather than superiority tests. Define guardrail thresholds before the experiment starts.
Randomization and targeting
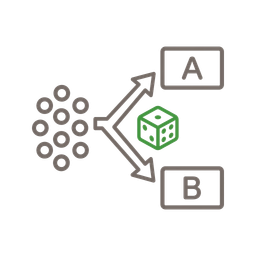
Deciding how users are assigned to experiment variants and who should be included. User-level randomization (hash the user ID to assign a consistent variant) is the standard – the same user always sees the same variant across sessions and devices. Session-level randomization is simpler but introduces noise from the same user seeing different variants. Only include users who are actually affected by the change – including unaffected users dilutes your experiment and makes it harder to detect real effects. Segment by platform, geography, or user type when the change only applies to a subset. Use holdout groups (a small percentage permanently on the control) to measure long-term cumulative effects of multiple experiments.

Multivariate testing
Testing multiple variables simultaneously to understand how they interact – useful when you suspect element combinations matter more than individual changes. A standard A/B test compares one change. A multivariate test might compare 3 headlines × 2 button colors × 2 layouts = 12 combinations simultaneously. The trade-off: you learn about interactions between elements, but you need exponentially more traffic. Full factorial testing examines every combination but demands enormous sample sizes. Fractional factorial uses statistical modeling to test a subset while inferring individual effects. The practical rule: use multivariate testing only on high-traffic pages where you genuinely don't know which combination will win. For most product teams, sequential A/B tests are faster and more actionable.

Experiment analysis and iteration
Reading results correctly and deciding what to do next. When the experiment reaches its predetermined sample size, analyze: is the primary metric statistically significant? What's the confidence interval? Are any guardrail metrics degraded? Check for Sample Ratio Mismatch (SRM) – if the variant split isn't close to 50/50, something is wrong with your randomization. Segment the results: did the effect differ by platform, user type, or geography? A positive average can mask negative impact on important segments. Three outcomes: ship the winner (clear positive result, no guardrail violations), iterate (promising direction but not significant – refine the hypothesis), or abandon (no signal or negative impact). Document learnings regardless of outcome.
Frameworks to know
The mental models and structured approaches that guide how you think about this skill – not rules to follow, but lenses to see through.
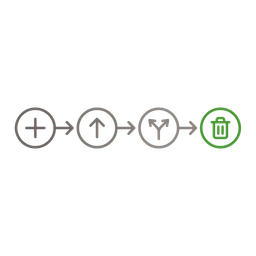
Feature flag lifecycle
The governance framework that prevents feature flags from becoming technical debt. Create: every flag gets a name (following conventions), an owner, and a sunset date. Deploy: ship code behind the flag, start with 0% rollout. Test: enable for internal users, then 1% canary, then experiment population. Decide: based on experiment results, either roll out to 100% or remove the code. Clean up: remove the flag from code within 30 days of full rollout. Audit: quarterly reviews to catch stale flags – healthy codebases maintain 20–30 active flags per service maximum. The anti-pattern: flags that live forever, accumulating into a tangle of conditional logic that nobody understands and nobody dares to remove.
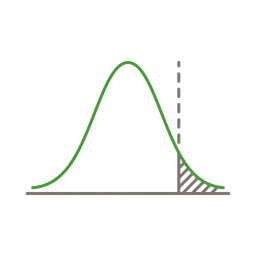
P-value
The statistical concept that underpins experiment decisions. A p-value answers: 'If there's truly no difference between A and B, what's the probability of seeing results this extreme by chance?' A p-value of 0.05 means a 5% chance the result is random noise. Setting a significance threshold (typically α = 0.05) before the experiment starts creates a clear decision rule: if p < α, the result is statistically significant. P-values don't tell you the effect is large or important – only that it's unlikely to be random. Always pair with confidence intervals to understand the range of plausible effect sizes, and with practical significance to decide if the effect is worth acting on.
Good vs. bad
Common mistakes paired with what experienced practitioners do instead – and why the product builder approach changes the game.



A/B testing is the closest thing product teams have to a scientific method. But most teams practice it like cargo cult science – they follow the rituals (random assignment, statistical significance) without understanding the principles (hypothesis formation, sample size, peeking). The result is experiments that produce numbers but not knowledge. The fix isn't more sophisticated statistics – it's more disciplined thinking before the experiment starts.
The peeking problem is the single most common experimentation failure I've seen. Teams that would never ship untested code will happily ship an A/B test result they checked on day 2 of a 14-day experiment. Evan Miller's paper should be required reading for every product manager. The discipline of not looking until the experiment is complete feels unnatural, but it's the difference between signal and noise.
Feature flags changed how I think about deployment and experimentation. Before flags, launching a feature was binary – it was either live for everyone or not. Now, every change goes through a progressive rollout: 1% canary, then experiment, then gradual rollout. The safety net is real: I've caught performance regressions at 1% that would have been P1 incidents at 100%. The cost of this safety is trivial – a few lines of conditional logic that get cleaned up within 30 days.
The biggest organizational challenge with experimentation isn't statistical – it's cultural. Teams that celebrate only 'winning' experiments create an incentive to avoid bold tests and to interpret ambiguous results as wins. The best experimentation cultures I've seen celebrate learnings, not just lifts. A well-designed experiment that proves your hypothesis wrong is more valuable than a poorly-designed one that 'confirms' what you already believed.
Go deeper
Books to deepen your understanding beyond what fits on this page.
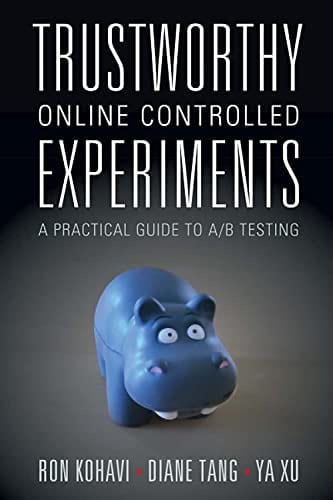
The definitive A/B testing book – by experts from Microsoft, Google, and LinkedIn who each run 20,000+ experiments yearly. Covers theory, pitfalls, and practical advice from decades of experimentation at scale.

Harvard Business School professor's case for building experimentation into organizational culture – covers how companies like Booking.com, Amazon, and Microsoft use experiments to make better decisions.
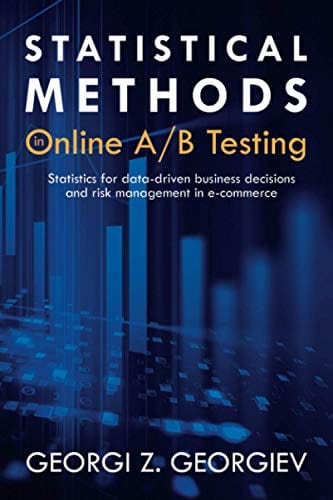
Deep dive into the statistics behind A/B testing – sample size calculation, sequential testing, multiple testing correction, and practical guidance for analysts who want to understand the math.
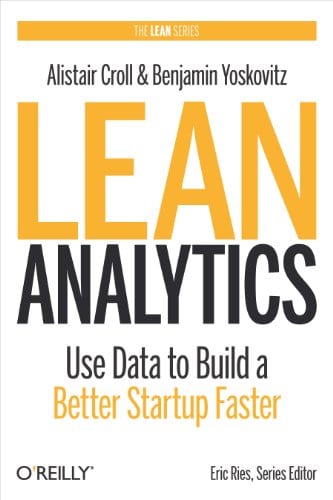
How to use data to build a better startup faster – covers the One Metric That Matters, analytics stages, and how experimentation fits into the build-measure-learn cycle.

Comprehensive open-source guide covering experiment design, statistical methods (CUPED, sequential testing, Bayesian), common problems, and practical implementation with GrowthBook's warehouse-native platform.